What's Your Medical Billing AR Score? 5 Key Indicators of Accounts Receivable Health.
- Sep 11, 2014
- 5 min read

We certainly love our football in the South! Fans from both teams long for success on game day. That success hinges on how well each team sets its strategy and how well they follow through with that strategy. In the end, the team with the best score wins. A provider clinic is much like a football team. The success of your clinic depends on how well you strategize your procedures. A provider can measure success (the score) with certain key indicators.
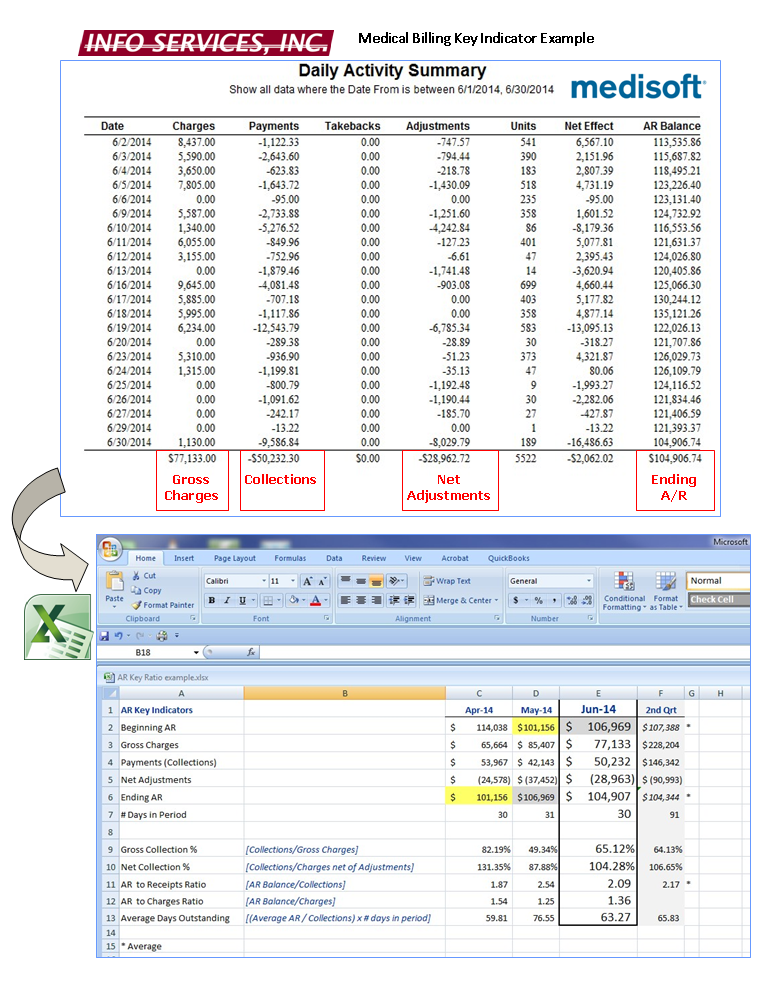
In this article we list five key indicators which can help a provider determine how successfully their clinic is playing the medical billing game. Each of these key indicators can be calculated from information found in MediSoft Reports seen below in our example.
Gross Collection Percentage:
The GCP indicates the percentage of gross original charges (before any adjustments/contractual write-offs) that has been collected and can be expected to be collected on an ongoing basis. Because fees originally charged can be astronomically above the fee schedules of your insurance carriers, this ratio by itself does not reveal a great deal. It should be used in conjunction with the Net Collection Percentage (below) to help analyze the feasibility of your fee structure. If your practice is primarily non-insurance and most payment is received on the date of service, this ratio will likely be high. If your practice charges far more that the allowed amount then the result will be low.
This percentage is calculated by dividing dollar Collections by dollar Gross Charges [Collections / Gross Charges]. This calculation can (and should) be used on monthly results as well as quarterly, annually and with multiple years. The Rule of Thumb for the average practice with heavy insurance participation is 70-75%. The ratio could be as high as 90% for those primarily cash practices.
Net Collection Percentage:
The NCP isolates the percentage of collections to a more realistic collectible amount. It eliminates the markup between the billed amount and the allowed amount which will have to be written-off. The monthly results of this indicator can vary depending on perhaps seasonal charge volume, how quickly the charges are billed and the pay lag of prominent carriers. For example, a provider may perform high dollar surgeries the last week of the month. Payment for the surgeries will probably not be seen until the next month or even two months after the surgeries depending on the payor.
This percentage is calculated by dividing dollar Collections by dollar Net Adjusted Charges [Collections / (Charges – Contractual Adjustments – Patient adjustments)]. The Net Collection Percentage goal ratio is to collect 90-100 % of all collectible charges. But be aware that a high Net Collection Percentage can also be covering up issues with loose adjustment practices. Require your billing clerk to use controlled unique adjustment codes for the types of adjustments (insurance, medical necessity, timely filing, patient bad debt, professional courtesy, etc.). Reviewing not only the monthly calculation but also quarterly, yearly and multi-year results is fundamental in the analysis of clinic success.
Important issues to note:
Contractual adjustments should be reviewed to determine if insurance carriers are appropriately adjusting per your agreement.
Are charges being billed out and error reports worked in a reasonable time frame after the date of service? Are you receiving timely filing denials?
Review remittance advices for denials. Do you have procedure denials due to medical necessity? Has your coder been trained on the official coding guidelines including modifiers? Review carrier policies to determine what diagnoses are deemed necessary to support that procedure. CMS procedure coverage lookup can be found here.
Review denials based on patient coverage. Is your front-office staff trained to collect all pertinent information each and every visit? Are they verifying insurance coverage prior to the appointment?
Review patient balance write-offs. Do you have a solid policy on patient collections? Are patients asked to pay all outstanding balances prior to the appointment? SEE BLOG ON PATIENT COLLECTIONS HERE.
Accounts Receivable to Receipts Ratio:
The AR to Receipts Ratio indicates how quickly the average account is being paid. High ratios may indicate that some balances should be deemed uncollectible and turned over to a collection agency or written off as bad debt. Review patient collection policies to keep a handle on the validity of your accounts receivable balance. SEE OUR BLOG ON PATIENT COLLECTIONS HERE.
This ratio is calculated by dividing the ending Accounts Receivable Balance by Collections [AR Balance / Collections]. The rule of thumb for this ratio is as follows: Excellent 2.0 – 3.5; Good 3.5 – 4.0; Challenges 4.0 – 5.0; Problems >5.0
Accounts Receivable to Charges Ratio:
The benefit of the AR to Charges Ratio is to review the consistency of the calculation over a period of months. If there is good Accounts Receivable management then this number will be fairly consistent from month to month. It should also be somewhat similar to the AR to Receipts Ratio (above). If numbers vary dramatically, it may indicate that the practice is highly influenced by seasonal changes.
This ratio is calculated by dividing the ending Accounts Receivable Balance by Charges for the month [AR Balance / Charges]. Any number above 5.0 justifies a serious look at the practice’s economic health.
Average Days Outstanding:
The results of the ADO calculation indicate how long it takes to collect on a charge, i.e., the turnover rate. The greater this number, the longer it takes insurance plans and patients to pay you. The turnover rate depends not only on insurance carrier payment practices but also how well the AR is being managed with prudent medical billing and patient collection practices.
This ratio is calculated by multiplying AR to Receipts ratio by the number of days in that month, except that in this calculation the average AR is used [(Beginning AR + Ending AR)/2]. The full formula is [(Average AR Balance / Collections) x number of days in period].
In the example below, you can see how easily these Key Indicators can be calculated by pulling a few numbers from the MediSoft Monthly Practice Analysis or Daily Activity Summary into an Excel or other spreadsheet and creating formulas. The MediSoft Daily Activity Summary is useful because you can see charge and payment patterns within the month which may affect the ratio results.
If looking at these formulas makes your head spin causing a desire to “get out of the game” then Info Services, Inc. can help you keep score and create a strategy! With our Professional Billing Services a provider has access to not only over 160 years combined medical billing experience, three Certified Coding Specialists-Physician Based and a CPA, but also a full quarterly practice management review and reporting which includes in-depth analyses of these five key indicators as well as a full insurance aging review of outstanding insurance balances. If a charge has not been collected within 90 days- we tell you why. On the other hand, if you think you have a good grasp on your medical billing but are having trouble keeping your accounts receivable score, give us a call and we can help you with a Key Indicator Analysis.
With increasing governmental regulations and regular patient workload blocking your way, it becomes harder and harder to cross that goal line in medical billing. Info Services, Inc. is here to help you set a solid strategy to break through the line and score!


Comments